

AI observability is the continuous collection and correlation of telemetry that shows whether an AI system's outputs are correct, safe, and cost-effective. It goes well beyond uptime dashboards. Where traditional monitoring tells you the service is running, AI observability tells you whether what the service is saying is accurate, grounded, and within policy.
For any team running production LLMs or agentic pipelines, three things depend on it directly:
- Correctness. Probabilistic models can return plausible-sounding but factually wrong answers even when every infrastructure metric is green. Observability instruments the output layer so those silent failures surface.
- Safety and compliance. The ICO expects organisations to demonstrate accountability for automated decisions. Tracing prompt assembly, retrieval steps, and tool calls gives you the audit trail to show that an automated service behaved within policy.
- Cost control. Token usage and model-call costs compound quickly at scale. Telemetry tied to OpenTelemetry standards lets you set cost SLOs and catch runaway spend before it hits the invoice.
Gmdautomation ships observability as a built-in component of every managed AI deployment it operates for UK businesses, not as an afterthought.
Table of Contents
- How does AI observability differ from traditional monitoring?
- What telemetry does AI observability actually capture?
- How does AI observability work in practice?
- Which tools and components make up an AI observability stack?
- How do you implement AI observability in a UK organisation?
- What are the common operational challenges and how do you address them?
- How Gmdautomation applies AI observability in UK deployments
- Key takeaways
- Why most AI teams are solving the wrong problem first
- Gmdautomation: production-ready AI with observability built in
- Useful sources and further reading
How does AI observability differ from traditional monitoring?
The simplest way to frame it: monitoring answers known questions, observability supports open-ended investigation. Ask "is the API responding?" and monitoring gives you the answer. Ask "why did the model hallucinate a product specification in that customer conversation?" and you need observability.
Traditional monitoring was designed for deterministic software. A function either returns the right value or it throws an error. You define thresholds, set alerts, and the system pages you when a threshold is crossed. That model breaks down for LLMs and retrieval-augmented generation (RAG) pipelines, where the same input can produce different outputs on different runs, and where "correct" is a matter of context and judgement rather than a binary pass/fail.
Dynatrace describes the distinction precisely: traditional monitoring focuses on predefined metrics and alerts, while AI observability enables open-ended investigation into unexpected, probabilistic model behaviour. The practical implication is that monitoring will not catch a model that has drifted toward shorter, less grounded answers over time, or a retrieval step that is silently returning stale documents. Both failures look fine on a latency graph.
Failure modes that monitoring typically misses include:
- Hallucinations. The model confidently asserts something false. Infrastructure metrics show nothing unusual.
- Retrieval errors. The RAG pipeline fetches the wrong documents. Latency is normal; the answer is wrong.
- Prompt injection. A malicious input manipulates the model's behaviour. No exception is thrown.
- Gradual drift. Response quality degrades slowly over weeks as the underlying model is updated or the data distribution shifts.
- Policy violations. The model produces output that breaches content policy or regulatory constraints, with no runtime error to trigger an alert.
For a deeper look at how AI performance monitoring relates to these observability concepts, the distinction between the two disciplines matters when scoping a tooling budget.
Pro Tip: Instrument the inference path before you instrument anything else. Logs and metrics on the application server are useful, but a trace that spans prompt construction, retrieval, model call, and post-processing gives you the context to debug any of the failure modes above in minutes rather than hours.
What telemetry does AI observability actually capture?
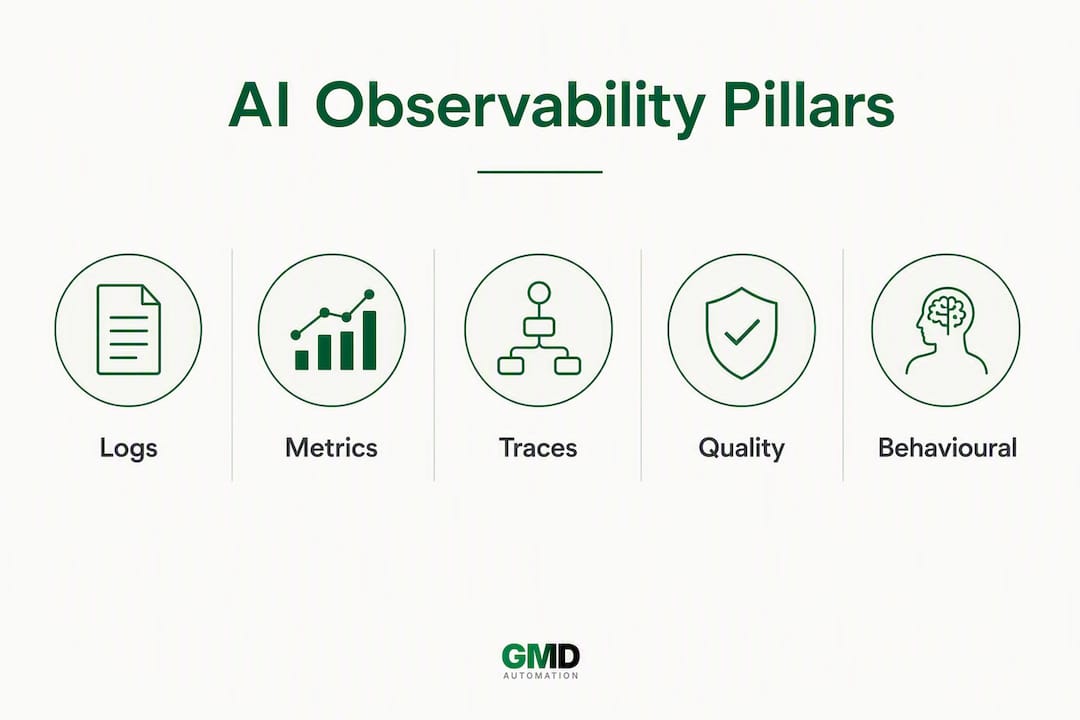
The traditional observability model rests on three pillars: logs, metrics, and traces. AI systems keep all three and add a fourth that is specific to model behaviour.

Datadog's knowledge centre frames it clearly: uptime and latency remain important but are insufficient to detect incorrect or unsafe outputs from generative models. The fourth pillar, variously called quality telemetry, behavioural telemetry, or safety telemetry, is what makes observability actionable for AI.
Logs
In an AI context, logs capture the structured record of each interaction: the raw prompt sent to the model, the system prompt, any retrieved documents, the model's response, the model version, and any errors or retries. Logging at this level is what makes post-incident debugging possible. Without it, you are reconstructing what happened from memory.
Metrics
Metrics aggregate behaviour over time: request volume, error rates, latency percentiles, token counts per request, cost per session, and cache hit rates. These feed SLO dashboards and cost alerts.
Traces
Traces are the floor for AI observability. A single user request in a RAG or agentic system can involve prompt construction, one or more retrieval calls, multiple model invocations, and downstream tool calls. A trace ties all of those spans together under a single request ID, so you can open any request and see every step in sequence. Without traceability, debugging is fragmented and slow.
The fourth pillar: quality and behavioural telemetry
This is where AI observability diverges from everything that came before it. Quality telemetry captures signals about what the model said, not just how fast it said it. It includes:
| Signal | Purpose | Typical alert or SLO |
|---|---|---|
| Token usage per request | Cost control, abuse detection | Alert if p95 token count exceeds budget threshold |
| Response quality score (LLM-as-judge) | Detect degradation in groundedness or relevance | SLO: quality score ≥ 0.80 over rolling 24 hours |
| Model drift indicator | Detect distributional shift in outputs over time | Alert on sustained drop in quality score |
| Retrieval precision | Confirm RAG is fetching relevant documents | SLO: retrieval precision ≥ 0.75 |
| Hallucination flag | Identify factual assertions not grounded in context | Alert on any flagged response in high-stakes flows |
| Implicit user feedback | Edits, retries, session abandonment as failure signals | Alert if retry rate exceeds baseline by 20% |
Token usage is the count of input and output tokens consumed per model call. It drives cost and is the primary lever for budget control.
Model drift refers to a gradual change in the statistical distribution of model outputs, often caused by model updates, prompt changes, or shifts in the incoming data. It rarely triggers a hard error.
Evals (evaluations) are automated quality judgements. They run deterministic checks (does the response match a required schema?) and more sophisticated LLM-as-judge scoring to assess relevance, groundedness, and instruction adherence. Evals differentiate AI observability from traditional monitoring because they assess what was said, not just whether the service responded.
How does AI observability work in practice?
The standard implementation pattern follows the request lifecycle from user input to feedback capture.
The sequence looks like this:
- User submits input to the application layer.
- The orchestration layer constructs the prompt, retrieves relevant documents (if RAG), and assembles the context window.
- An SDK wrapper intercepts the model call, capturing the prompt, model ID, and request metadata before the call reaches the model provider.
- The model returns a response. The wrapper captures the response, token counts, latency, and cost.
- Post-processing applies guardrails, schema validation, and real-time evals.
- The response is delivered to the user.
- Implicit feedback signals (retries, edits, session abandonment) and explicit ratings are captured and fed into the evaluation pipeline.
SDK wrappers are the standard integration pattern for production-grade systems. The observability tool supplies a wrapped client that sits in front of the model provider's SDK. Every call automatically captures prompt, response, tokens, model version, and metadata. This simplifies correlation and audit trails considerably.
What to capture at each stage
- Prompt construction: full prompt text, system prompt version, retrieved document IDs and scores, context window size.
- Model call: model ID and version, input token count, output token count, latency, cost estimate, any retry attempts.
- Post-processing: guardrail outcomes, schema validation results, eval scores (groundedness, relevance, safety).
- User feedback: explicit ratings, implicit signals (edit distance between model response and user's final text, retry count, time-to-abandon).
Implicit user behaviour such as edits, retries, and session abandonment often yields higher-quality failure signals than explicit thumbs-up/thumbs-down ratings. A user who silently rewrites the model's output is telling you something important.
Evals integrate at two points: real-time checks run in the post-processing step before the response is delivered, catching safety violations and schema errors immediately. Batch evals run asynchronously over recent conversations, using LLM-as-judge scoring to assess quality trends.
Pro Tip: Do not attempt full capture at launch. Start with a 10–20% sample of production traffic for LLM-as-judge evals. Full capture is expensive and the signal-to-noise ratio is low until you have calibrated your scoring rubric against real failure cases.
Understanding why AI testing is critical for UK businesses gives useful context on how evals in production relate to pre-deployment testing practices.
Which tools and components make up an AI observability stack?
The technology stack has six functional layers. Each can be assembled from open-source components, commercial platforms, or a combination.
- SDK wrappers and instrumentation libraries. These intercept model calls and emit structured telemetry. Most major observability vendors supply their own; open-source options exist for common frameworks.
- Tracing layer. Correlates spans across the full request lifecycle. OpenTelemetry is the open standard here: it reduces vendor lock-in and makes it straightforward to combine telemetry from infrastructure, application, and model layers into cohesive dashboards. Adopting it as a foundation means you are not rebuilding instrumentation every time you change a vendor.
- Evaluation engine. Runs deterministic and LLM-as-judge evals against captured conversations. This is the layer most specific to AI observability.
- Feedback capture. Collects explicit ratings and implicit behavioural signals from the application layer.
- Cost telemetry. Aggregates token usage and model-call costs, typically broken down by user, session, or feature.
- Dashboarding and alerting. Surfaces SLO compliance, quality trends, cost burn, and anomalies. Feeds runbooks and on-call workflows.
Tools worth evaluating
Dynatrace offers end-to-end AI observability integrated with its broader application performance management platform. It covers infrastructure, application, and model layers in a single pane, which suits enterprises that already run Dynatrace for their wider estate. Available to UK organisations with EU data residency options.
Datadog provides LLM observability as a dedicated product within its platform, covering traces, evals, prompt management, and cost tracking. Its OpenTelemetry support is mature, and it integrates with most major model providers. UK-based teams can configure data residency within the EU.
Seldon (Seldon-io) focuses on model deployment and monitoring for machine learning in production. It is particularly strong for teams running custom models rather than third-party LLM APIs, offering drift detection, explainability, and performance monitoring at the model-serving layer.
Weights & Biases is widely used for experiment tracking and model evaluation during development, and its Weave product extends into production tracing and eval management. Useful when the same team owns both training and production.
Evidently is an open-source framework for ML monitoring and evaluation. It generates data quality and model performance reports, making it a practical choice for teams that want to own their observability stack without a commercial licence.
When evaluating vendors, the key question is whether their instrumentation layer emits OpenTelemetry-compatible telemetry. If it does, you can swap components without rebuilding your entire pipeline. If it does not, you are accepting lock-in at the instrumentation layer, which is the hardest layer to migrate later. A useful procurement checklist for assessing AI vendors covers this and related integration questions in detail.
How do you implement AI observability in a UK organisation?
This checklist is ordered by dependency: each step builds on the one before it. Teams that skip scoping and jump straight to instrumentation typically end up with telemetry they cannot act on.
Step-by-step implementation checklist
-
Define scope and risk tier. Identify which AI systems are in scope. Classify each by risk: customer-facing generative outputs carry higher stakes than internal summarisation tools. Risk tier determines SLO stringency and data retention requirements.
-
Set SLOs before you instrument. Define what "good" looks like before collecting data. Suggested starting points:
- Quality SLO: LLM-as-judge groundedness score over a rolling monitoring window indicating high quality.
- Latency SLO: Response time targets set for synchronous user-facing calls to ensure responsiveness.
- Cost SLO: average cost per session maintained within budget thresholds, with alerts set below the maximum spending limit.
- Safety SLO: no policy-violating responses allowed in high-stakes flows within monitoring periods.
-
Instrument the inference path. Deploy SDK wrappers on all model clients. Emit OpenTelemetry-compatible traces covering prompt construction, retrieval, model call, and post-processing. Assign a correlation ID to every request.
-
Instrument feedback capture. Add explicit rating widgets where appropriate. Instrument implicit signals: retry counts, edit distance, session abandonment.
-
Stand up the evaluation engine. Configure deterministic checks (schema validation, content policy filters) to run in real time. Configure LLM-as-judge evals to run asynchronously on a sampled subset of production traffic.
-
Configure storage and retention. Store full prompt/response logs in a secure, access-controlled store. Define retention periods aligned with your data minimisation obligations (see GDPR bullets below). Separate PII-containing logs from aggregate metrics.
-
Build dashboards and alerting. Wire SLO compliance, quality score trends, cost burn, and anomaly alerts into your existing incident management tooling. Every alert should link to a runbook.
-
Write runbooks. For each alert type, document: what the alert means, the first three diagnostic steps, the escalation path, and the rollback or mitigation action. A runbook for a quality SLO breach might read: check eval scores by model version → check retrieval precision → compare against last known-good prompt version → roll back if degradation is confirmed.
-
Schedule post-incident reviews. Treat quality regressions as incidents. Run a lightweight post-mortem, update the eval rubric if the failure exposed a gap, and feed findings back into the next deployment cycle.
UK GDPR and ICO compliance considerations
- Data minimisation. Log what you need to debug and evaluate; do not log everything by default. Prompt logs that contain personal data must have a documented lawful basis.
- Pseudonymisation. Replace user identifiers in telemetry with pseudonymous session IDs before logs reach the observability store. Map the pseudonym to the real identity only in a separate, access-controlled system.
- Retention limits. Set automated deletion schedules. Full prompt/response logs are rarely needed beyond 30–90 days for debugging purposes; aggregate metrics can be retained longer.
- Supplier management. If your observability vendor processes personal data on your behalf, a Data Processing Agreement is required. Confirm the vendor's data residency and sub-processor list before onboarding.
- AI system transparency. The ICO's guidance on automated decision-making expects organisations to be able to explain how an automated system reached a conclusion. Trace data is your evidence. For more on this, the AI system transparency guide covers the governance angle in detail.
For broader governance frameworks, AI governance for businesses provides policy templates that complement the compliance bullets above.
What are the common operational challenges and how do you address them?
Running AI observability in production surfaces a predictable set of problems. None of them are blockers, but each requires a deliberate mitigation strategy.
Volume and storage cost. Full prompt/response logging at scale generates large data volumes quickly. Mitigation: use tiered storage (hot storage for recent logs, cold storage for archives), apply sampling for LLM-as-judge evals (10–20% of traffic is usually sufficient for trend detection), and set aggressive retention policies for raw logs.

Alert fatigue. Poorly calibrated quality SLOs generate noise that teams learn to ignore. Mitigation: start with conservative thresholds and tighten them as you accumulate baseline data. Route low-severity quality alerts to a Slack channel rather than paging on-call engineers.
Privacy and PII in logs. Prompt logs frequently contain personal data, especially in customer-facing applications. Mitigation: pseudonymise at the point of capture, not after the fact. Build PII scrubbing into the SDK wrapper before telemetry leaves the application.
Drift detection latency. Gradual model drift is slow to surface if you only look at aggregate metrics. Mitigation: run cohort-based quality analysis weekly, comparing quality scores across model versions and time windows. A sudden model provider update can shift output quality overnight.
Eval calibration. LLM-as-judge scoring is only as good as the rubric. An uncalibrated judge will score confidently wrong answers as high quality. Mitigation: build a golden dataset of known-good and known-bad responses, and validate your judge against it before relying on its scores in production.
Pro Tip: Implicit user feedback is the highest-value, lowest-cost signal most teams are not capturing. Instrumenting retry counts and edit distance between model output and user's final submission costs almost nothing to add and often surfaces failure patterns weeks before they appear in quality scores.
A practical example
A UK financial services firm deployed a RAG-based document summarisation tool for internal analysts. Within three weeks of launch, the team noticed a gradual increase in analyst edit rates (captured via implicit feedback instrumentation). Drilling into the traces, they found that a retrieval index update had introduced a set of outdated policy documents. The model was faithfully summarising stale content. The issue was invisible to infrastructure monitoring; the edit-rate signal caught it in 48 hours. The fix was a retrieval index rollback and a new SLO on retrieval document recency.
How Gmdautomation applies AI observability in UK deployments
Gmdautomation's managed AI deployments for UK businesses are built with observability instrumented from day one, not retrofitted after go-live. The following describes the standard pattern applied across voice call handling, workflow automation, and social media management deployments.
Instrumentation choices:
- SDK wrappers on all model clients, emitting OpenTelemetry-compatible traces.
- Correlation IDs assigned at the application gateway, propagated through retrieval, model call, and post-processing spans.
- Implicit feedback capture (retry counts, session abandonment) instrumented in the application layer.
- Cost telemetry aggregated per client, per feature, and per time window.
SLOs set at onboarding:
- Response quality score ≥ 0.80 (LLM-as-judge, rolling 24 hours).
- p95 latency ≤ 3 seconds for synchronous flows.
- Zero policy-violating outputs in customer-facing flows within any 24-hour window.
- Cost per session within agreed budget envelope, with alerts at 80% of threshold.
Continuous improvement loop:
- Weekly cohort quality reviews comparing scores across model versions.
- Post-incident reviews for any SLO breach, with findings fed back into prompt and retrieval configuration.
- Monthly compliance review confirming data retention schedules and DPA status for all sub-processors.
Implementation checklist snippet for teams onboarding with Gmdautomation:
- Confirm data residency requirements and DPA with Gmdautomation before instrumentation begins.
- Define risk tier for each AI workflow (customer-facing vs internal).
- Agree SLO thresholds at the scoping workshop.
- Review runbook templates provided at deployment handover.
- Schedule first post-go-live quality review at 30 days.
The Gmdautomation demo agent is built on the same deployment systems used in production. Teams wanting to see the observability stack in action can request a walkthrough directly.
Key takeaways
AI observability is the discipline that keeps production AI systems honest: without it, a system can be fully operational by every infrastructure measure while silently returning incorrect, unsafe, or policy-violating outputs.
| Point | Details |
|---|---|
| Observability goes beyond monitoring | Monitoring confirms uptime; observability investigates why a model produced a specific output, catching silent failures monitoring misses. |
| Four telemetry pillars | Logs, metrics, and traces are necessary but not sufficient; the fourth pillar, quality/behavioural telemetry, is what makes AI observability distinct. |
| Evals are the core differentiator | Automated evaluations (deterministic checks and LLM-as-judge scoring) assess output correctness and safety, not just service availability. |
| UK GDPR compliance requires traceability | ICO accountability expectations mean prompt/response logs and trace data are your evidence for automated decision-making; pseudonymise at capture. |
| Gmdautomation ships observability built in | Every Gmdautomation managed deployment includes instrumentation, SLOs, eval pipelines, and compliance-aligned data handling from day one. |
Why most AI teams are solving the wrong problem first
The conventional wisdom in AI deployment is to get the model right, then worry about observability. That order is backwards, and it costs teams months of debugging time they never recover.
The deeper issue is that "getting the model right" in a development environment tells you almost nothing about how it will behave under real user inputs in production. Users do not behave like your test dataset. They ask ambiguous questions, inject unexpected context, and find edge cases your evaluation suite never imagined. The only way to know what your model is actually doing is to watch it do it, in production, continuously.
What I see repeatedly in UK deployments is teams that invest heavily in pre-deployment testing and then treat production as the finish line. It is not. Production is where the real evaluation begins. The teams that catch quality regressions in 48 hours rather than three weeks are not smarter; they instrumented implicit user feedback and set quality SLOs before they launched.
There is also a compliance dimension that UK organisations underestimate. The ICO's accountability principle does not ask whether your model was good at launch. It asks whether you can demonstrate, at any point in time, that your automated system behaved within policy. That requires trace data. It requires retention schedules. It requires a governance framework that treats observability as evidence, not just tooling. The organisations that will struggle with the UK's evolving AI regulatory environment are the ones treating observability as an engineering nicety rather than a compliance obligation.
Start with the inference path. Set your SLOs before you go live. Instrument implicit feedback on day one. Everything else can be added iteratively.
Gmdautomation: production-ready AI with observability built in
Most UK businesses deploying AI for the first time face the same gap: the model works in testing, but nobody has instrumented what happens in production. Gmdautomation closes that gap before go-live.
Every managed AI deployment from Gmdautomation ships with OpenTelemetry-compatible instrumentation, quality SLOs agreed at the scoping stage, and eval pipelines running from day one. There are no upfront costs: the subscription covers implementation, ongoing operation, SLO monitoring, and compliance-aligned data handling, including DPA management for all sub-processors. UK GDPR obligations around data minimisation, pseudonymisation, and retention are addressed in the deployment architecture, not bolted on afterwards.
For teams that want to see the observability stack before committing, the Gmdautomation demo agent runs on the same production systems. Visit gmdautomation.ai to request a walkthrough or discuss how managed AI services fit your organisation's deployment timeline.
Useful sources and further reading
-
AI observability — Wikipedia: A concise overview of the discipline, covering telemetry categories (infrastructure, model, and output signals) and the distinction from traditional monitoring. Good for a quick orientation or for citing in internal proposals.
-
What is AI observability? | Dynatrace: Dynatrace's knowledge-base entry explains the monitoring vs observability distinction clearly and covers how traces support root-cause analysis in multi-step AI pipelines.
-
What Is AI Observability? | Datadog: Covers the four-pillar model (logs, metrics, traces, quality telemetry), token usage, model drift, and the role of OpenTelemetry as a foundation for vendor-neutral instrumentation.
-
What Is AI Observability? Tools, Signals, and Best Practices | Respan: Detailed treatment of evals (deterministic and LLM-as-judge), implicit user feedback signals, and practical implementation patterns. Useful for engineers designing the evaluation pipeline.
-
What is AI observability (and how does it work)? | Twilio: Explains how observability supports investigation into multi-step agentic runs, with good coverage of retrieval quality and prompt assembly tracing.
-
What is AI observability? | PostHog: Practical focus on the SDK wrapper pattern, instrumentation architecture, and how to structure telemetry for correlation and auditing.
-
NIST AI Risk Management Framework (AI RMF 1.0): The US National Institute of Standards and Technology's framework for AI risk management. Widely referenced in UK enterprise AI governance discussions and useful for aligning observability practices with risk management obligations.
-
AI observability — Microsoft Azure AI Foundry: Microsoft's documentation on observability within the Azure AI Foundry lifecycle, covering evaluation frameworks, quality measurement, and production monitoring. Relevant for teams building on Azure-hosted models.
-
ISO/IEC 42001: The international standard for AI management systems. Increasingly referenced by UK procurement teams as a baseline for supplier assurance; observability practices map directly to its monitoring and measurement requirements.