

Automated operations KPI tracking replaces manual spreadsheet assembly with centralised, real-time dashboards that pull data directly from your ERP, CRM, WMS, and APIs. The result is a live view of operational performance, updated continuously, without anyone spending hours formatting reports. Tools such as Zoho Analytics, Fathom, and SimpleKPI sit at the practical end of this spectrum, each offering pre-built connectors and visual dashboards suited to different business sizes. For UK operations and IT managers, the core benefits are clear: faster reporting cycles, fewer data errors, and the kind of operational transparency that lets you act on problems before they compound. Compliance considerations, particularly around data residency and GDPR, make tool selection more deliberate for UK businesses than for counterparts elsewhere.
- Automated data collection from ERP, CRM, WMS, and API sources
- Centralised dashboards replacing manual spreadsheet workflows
- Real-time alerts and threshold monitoring
- Standardised reporting formats across departments
- Continuous monitoring rather than periodic manual reviews
Why automating KPI tracking transforms operational performance
The most immediate gain from automated KPI reporting is speed. Reporting cycles cut from days to minutes when data flows directly from source systems into a live dashboard, rather than being extracted, cleaned, and formatted by hand. That shift alone frees analysts and operations managers for work that actually requires human judgement.
Beyond speed, accuracy improves because the system removes the manual transcription step where most errors enter. Standardised data formats mean that figures from your warehouse management system and your CRM speak the same language on the same screen. Teams stop debating whose spreadsheet is correct and start discussing what the numbers mean.
- Faster reporting cycles from days to minutes
- Reduced manual workload for analysts and operations staff
- Improved data accuracy through direct system integration
- Standardised formats across operational data sources
- Continuous monitoring rather than weekly or monthly snapshots
- Enhanced accountability when dashboards are visible to operators and supervisors
- Subscription-based pricing models, with some KPI dashboard tools starting from $19/month, making adoption accessible for mid-sized UK businesses
Reporting cycles reduced from days to minutes when KPI data flows directly from source systems into live dashboards, eliminating manual extraction and formatting.
Automation also promotes accountability in a way that periodic reports cannot. When a dashboard is visible on the operations floor, operators know the targets and check performance throughout their shift. That visibility changes behaviour without requiring additional management overhead.
What does automated KPI reporting look like in practice?
Manufacturing is where automated operational metrics have the longest track record. A production manager monitoring Overall Equipment Effectiveness (OEE) across multiple lines gets a single percentage that combines availability, performance, and quality. World-class manufacturing aims for high OEE targets, but many plants operate well below this benchmark. Automated tracking makes the gap visible in real time rather than in a Monday morning report.
Logistics and supply chain operations automate on-time delivery rates, inventory turnover, and capacity utilisation. A distribution centre can monitor pick accuracy and despatch rates by shift, by operator, and by product mix, all from one screen. When a metric drops below threshold, an automated alert fires before the problem cascades.
- OEE tracking across production lines and shifts
- On-time delivery monitoring in logistics and despatch
- Inventory turnover and stock accuracy in warehousing
- Capacity utilisation across facilities
- Customer service resolution rates and SLA compliance
- First-pass yield and defect rates in manufacturing quality control
Customer service operations use automated dashboards to track resolution rates, average handling time, and SLA compliance. Zoho Analytics connects to CRM data and surfaces these metrics without manual exports. SimpleKPI suits teams that want straightforward tracking of a defined set of indicators without complex configuration. Fathom integrates directly with accounting platforms including Xero, QuickBooks Online, and Access Financials UK, making it particularly useful for UK finance and operations teams tracking both financial and non-financial KPIs.
Pro Tip: Collect baseline data across at least two to four weeks of production, covering different operators, shifts, and product mixes before you automate. A single shift gives you a best-case figure, not a representative one.

How do automation KPIs differ from standard business KPIs?
Automation KPIs measure the performance of the automation technology itself, not just the business outcomes it supports. This distinction matters because mixing the two can obscure whether a problem originates in your business process or in the automation agent running it.
The Operations Hub in Microsoft Azure's SRE Agent illustrates this well. It consolidates three separate views: an overview of system health, an incident analytics tab tracking hours saved and resolution rates, and an automation tab showing task success rates and run durations. Each tab answers a different question, and conflating them produces misleading conclusions.
Separating incident analytics from automation reliability KPIs prevents misattribution of failures, clarifying whether business processes or automation agents are at fault.
| KPI | Definition | Typical target |
|---|---|---|
| Success rate | Percentage of automated tasks completed without failure | — |
| Average run duration | Mean execution time per automated task | Stable or declining trend |
| Agent-supported resolution rate | Percentage of incidents resolved with automation assistance | Tracked against baseline |
| Estimated engineering time saved | Total hours saved by automation versus manual handling | Increasing quarter on quarter |
| First-pass yield | Percentage of units produced correctly on the first attempt | Process-dependent; tracked against pre-automation baseline |
| Unplanned downtime | Hours per shift lost to unexpected stops | Declining trend post-automation |
| Cycle time variability | Spread of cycle times around the mean | Narrowing distribution indicates stable automation |
- Success rate tracks completed automated tasks as a percentage of total runs
- Average run duration reveals whether automation is slowing over time
- Agent-supported resolution rate measures how often automation contributes to incident resolution
- Estimated engineering time saved quantifies the human hours automation replaces
- Cycle time variability exposes hidden process or programming issues that averages conceal
Cycle time variability is particularly telling. High variability in an automated cell points to a programming issue, a fixturing problem, or an upstream material inconsistency. Tracking the distribution of cycle times, not just the average, reveals root causes that a headline figure would hide.
How to implement automated operations KPI tracking step by step
Start with a baseline. Before any tool goes live, collect data on cycle time per unit, first-pass yield, unplanned downtime, labour hours per unit, and scrap costs across a representative period. Two to four weeks of production data, covering different operators and shifts, gives you a foundation for measuring genuine improvement rather than noise.
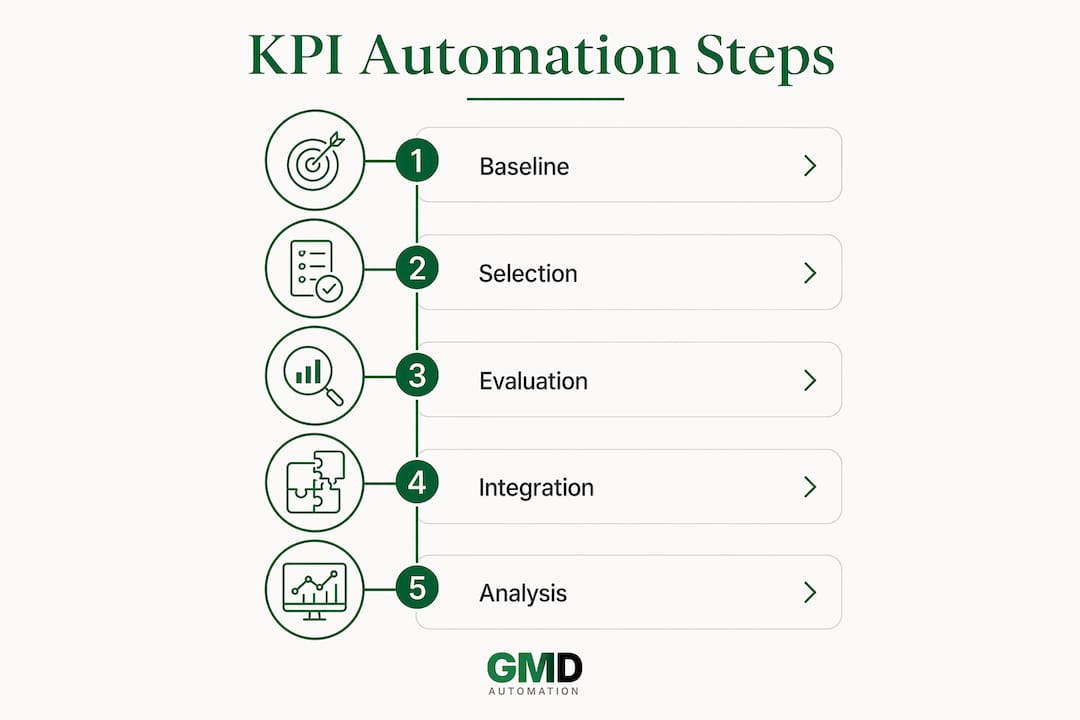
Phase 1: KPI selection. Identify the five to seven KPIs that matter most for your operation. A dashboard with forty metrics is noise. Prioritise the indicators directly linked to your operational goals, whether that is throughput, quality, delivery, or cost.
Phase 2: Tool evaluation. Assess tools against integration capability, real-time update frequency, ease of configuration, and GDPR compliance for UK data handling. Zoho Analytics connects to business apps, databases, and live feeds. Fathom integrates with UK-compatible accounting platforms. SimpleKPI suits teams that need straightforward setup without technical overhead. For identifying which processes are best suited to automation, a structured assessment before tool selection saves significant rework later.
Phase 3: Integration and dashboard setup. Connect your data sources, configure refresh intervals, and build dashboards visible to operators, supervisors, and management. Visible KPI tracking changes behaviour on the floor in ways that buried weekly reports cannot.

Phase 4: Validation and training. Run automated and manual figures in parallel for two to four weeks to confirm accuracy. Train staff on reading and acting on dashboard data, not just viewing it.
Phase 5: Continuous monitoring. Daily tracking with weekly reviews is the minimum cadence for a new automation system. Monthly reports catch problems too late.
- Collect baseline data before automation begins
- Select five to seven critical KPIs aligned to operational goals
- Evaluate tools on integration depth, real-time capability, and UK data compliance
- Validate automated figures against manual data during parallel running
- Make dashboards visible to operators and supervisors, not just management
- Review daily; escalate anomalies within the same shift where possible
- Address data silos early by mapping all source systems before integration begins
Pro Tip: Analyse cycle time distributions rather than averages during your first month of live tracking. A stable average with high variability signals a fixturing or programming problem that the headline figure would otherwise mask.
What makes an effective KPI dashboard design?
The best operational dashboards answer one question at a glance: are we on track? That requires deliberate design choices, not just connecting data sources and accepting default charts.
Zoho Analytics supports a range of visualisation types including KPI cards, trend charts, pivot tables, and drill-down views, all combinable in a drag-and-drop layout. A well-structured operations dashboard typically places the most critical KPIs as large scorecard widgets at the top, with trend lines beneath showing direction over the past 30 days. Threshold colouring, green for on-target, amber for approaching limit, red for breach, communicates status faster than any number.
Drill-down capability separates a useful dashboard from a decorative one. Selecting a KPI card should reveal the underlying breakdown: by shift, by line, by product, or by operator. Microsoft's Operations Hub demonstrates this with its three-tab structure, where each KPI card expands into detailed charts and AI-generated summaries of recent executions. That pattern, summary at the top, detail on demand, works equally well for manufacturing OEE dashboards and logistics delivery trackers.
Role-based access matters too. Operators need their line's metrics. Supervisors need cross-line comparisons. Senior managers need aggregated trends. Zoho Analytics and SimpleKPI both offer fine-grained access controls that let you share the right view with the right person without exposing data they do not need.
For UK businesses with multiple sites, consolidating KPI results across locations in a single benchmarking view, a feature Fathom offers natively, removes the need for manual cross-site comparison reports.
How do you measure ROI after automating KPI tracking?
ROI from KPI automation has two components: cost reduction and capability gain. The cost side is straightforward to calculate: add up software subscription fees, integration costs, training, and ongoing maintenance, then compare against the labour hours previously spent on manual reporting and the errors that manual processes generated.
The capability side is harder to quantify but often larger. Faster access to accurate data means faster decisions. A logistics manager who previously waited until Friday for a weekly delivery report can now act on Thursday afternoon's data before the problem affects Monday's despatch. That responsiveness has real value, even if it does not appear directly on a cost spreadsheet.
ROI expressed as both a payback period in months and an annualised percentage return gives leadership the two figures they actually need: how long before the investment pays back, and what the ongoing return looks like. Presenting only one of these typically leaves questions unanswered in board-level conversations.
A common mistake is counting only direct labour savings. The full picture includes reduced rework costs, lower error rates in reporting, improved customer satisfaction from better operational visibility, and capacity gains that let teams take on additional work without adding headcount. For a structured approach to calculating automation ROI in a UK context, working through a break-even analysis before and after implementation gives you defensible numbers rather than estimates.
Track KPI improvements at three stages: commissioning (first two weeks), ramp-up (60–90 days), and steady state (three to six months). Steady-state figures are what your ROI calculations should rest on, not the optimistic numbers from the first week of go-live.
Gmdautomation: AI-powered KPI automation for UK operations
The tools covered in this guide handle dashboards and reporting well. What they do not do is deploy, integrate, maintain, and continuously improve the underlying automation systems that feed those dashboards. That is where Gmdautomation operates.
Gmdautomation builds and deploys enterprise-grade AI automation systems for UK businesses, covering implementation, operation, maintenance, and ongoing optimisation under a single monthly subscription with no upfront capital cost. For operations managers who want automated KPI tracking without the internal IT project that typically precedes it, that model removes the biggest barrier to getting started. Systems are designed for UK compliance requirements, including GDPR, and can be scaled as operational needs change.
If you are ready to move from manual reporting to live operational intelligence, explore what Gmdautomation delivers for UK businesses and request a demonstration of their deployment approach.
Key takeaways
Automated operations KPI tracking delivers its greatest value when you select five to seven critical metrics, integrate them into visible real-time dashboards, and separate automation reliability KPIs from standard business performance indicators.
| Point | Details |
|---|---|
| Reporting speed | Automated dashboards cut reporting cycles from days to minutes by pulling data directly from source systems. |
| KPI selection discipline | Track five to seven critical KPIs daily; tracking more than this dilutes focus and produces noise rather than insight. |
| OEE as the benchmark | World-class manufacturing targets around 85% OEE; automated tracking makes the gap between current and target visible in real time. |
| Separate automation KPIs | Keep automation reliability metrics (success rate, run duration) distinct from business KPIs to accurately diagnose performance issues. |
| Gmdautomation for UK deployment | Gmdautomation deploys AI automation systems for UK businesses under a monthly subscription, covering integration, compliance, and ongoing optimisation. |