
AI automation break-even analysis is the calculation that identifies the exact point at which an automation investment pays for itself through accumulated time and cost savings. For UK business owners and financial analysts evaluating AI adoption in 2026, this calculation is not optional. It is the difference between a sound investment and an expensive distraction. The core formula is straightforward: Setup Time ÷ (Time Saved per Instance × Monthly Frequency). If the result exceeds six months, the automation does not pay off. Platforms like CallSphere and Energent.ai have made this calculation more accessible, but the principles of managerial accounting still govern the result.
What is AI automation break-even analysis?
AI automation break-even analysis is the process of determining how long it takes for an automated system to recover its implementation costs through operational savings. The industry term for the underlying model is cost-volume-profit (CVP) analysis, adapted here for AI deployment decisions. Both terms appear throughout this guide because both matter: CVP gives you the accounting rigour, and the AI automation framing keeps the focus on deployment decisions.
The break-even formula for AI automation is: Setup Time ÷ (Time Saved per Instance × Monthly Frequency). A result under six months signals a worthwhile investment. A result over six months is a clear signal not to automate that task. This threshold is not arbitrary. It reflects the reality that AI tools, platforms, and business needs change quickly enough to make longer payback periods unreliable.
Consider a practical example. If setting up an automated invoice processing workflow takes two hours, and it saves 15 minutes per invoice with four invoices processed monthly, the break-even point is two months. That is a strong case for automation. The same formula applied to a task that saves five minutes twice a month produces a break-even of 12 months, which falls outside the viable window.

What costs and savings go into the calculation?
Accurate break-even calculations require clean cost categorisation. Fixed costs must be separated from variable costs before any meaningful analysis is possible. Fixed costs include salaries, software licences, and infrastructure. Variable costs include materials, transaction fees, and, critically for AI, usage-based charges.
The hidden costs of AI automation are where most calculations go wrong. Token usage fees, inference charges, and per-call billing can escalate significantly as task volume grows. These costs must be treated as variable costs per task or per user, not as a flat monthly overhead. A platform that charges £149 per month at low volume may cost considerably more once usage scales, and that shift changes the break-even point entirely.
Setup time is also a cost, not just a one-off inconvenience. Every hour spent configuring, testing, and training an AI system is an hour of staff time with a real monetary value. UK businesses should calculate setup time at the fully loaded cost of the person doing the work, including employer National Insurance contributions and any contractor fees.
Pro Tip: When estimating ongoing savings, use the fully loaded hourly cost of the employee whose time is being freed, not just their base salary. This produces a more accurate contribution margin and a more defensible business case.
The contribution margin in CVP analysis is the price of a unit minus its variable cost. In AI automation terms, this translates to the value of time saved per task minus the variable cost of running the AI for that task. Getting this figure right is the foundation of the entire analysis.
Which AI tools help with automated break-even calculation?
Several platforms now offer AI-driven financial analysis capabilities that directly support break-even modelling. The table below compares the most relevant options for UK businesses in 2026.
| Tool | Key capability | Pricing model | Time to value |
|---|---|---|---|
| Energent.ai | Processes up to 1,000 files per prompt at 94.4% accuracy | Not publicly listed | Fast data consolidation |
| Datarails | Anomaly detection and financial variance flagging | Not publicly listed | Mid-term deployment |
| Kepler (Anthropic) | Audit-grade, traceable calculations at 94% accuracy | Not publicly listed | Enterprise deployment |
| CallSphere | Flat-rate AI agent platform with pre-built solutions | ~£149/month | 3–5 days |
Energent.ai stands out for data consolidation. It can process up to 1,000 diverse files in a single prompt with 94.4% accuracy, reducing manual data consolidation time by up to 70%. For UK finance teams pulling cost data from PDFs, Excel sheets, and scanned invoices, that capability directly reduces the input effort for break-even modelling.
Datarails takes a different approach. Its anomaly detection flags unusual cost variances against historical seasonal patterns, which protects against data errors that would otherwise skew a break-even result. This is particularly valuable for businesses with seasonal cost structures, such as retail or hospitality.
Kepler, spotlighted by Anthropic, addresses the audit problem directly. It delivers fully traceable calculations by mapping business terms to exact data sources, achieving 94% accuracy on financial line items. For finance teams that need to defend their numbers to auditors or boards, that traceability is not a luxury.
CallSphere represents the operational end of the market. Its flat-rate pricing model at around $149 per month removes the unpredictability of per-minute billing, and its pre-built vertical solutions reduce deployment time from weeks to 3–5 days. That speed directly reduces setup time costs in the break-even formula.
Pro Tip: Choose a platform with transparent, flat-rate pricing before you run your break-even calculation. Variable pricing models make the denominator of your formula a moving target, which undermines the entire analysis.
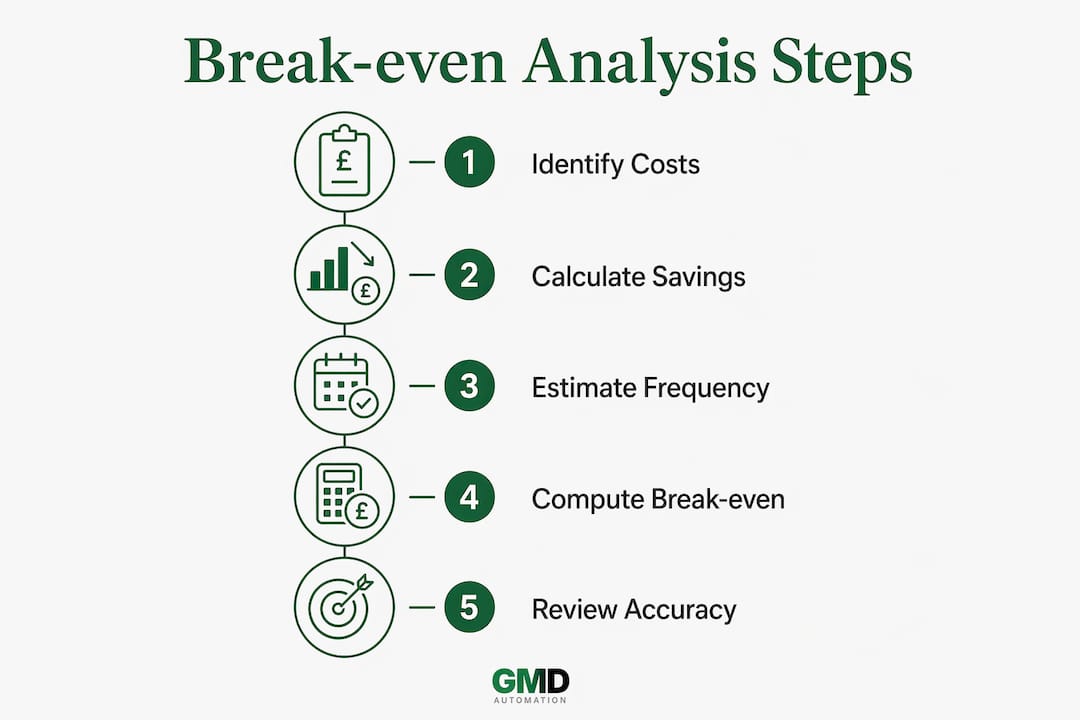
How to perform an automated break-even analysis step by step
A reliable automated break-even calculation follows a defined sequence. Skipping steps produces numbers that look credible but mislead decisions.
-
Identify the task to be automated. Define it precisely. "Customer onboarding" is too broad. "Sending welcome emails and populating the CRM record after a new contract is signed" is specific enough to measure.
-
Measure setup time accurately. Log every hour spent on configuration, testing, integration, and staff training. Include the cost of any external consultants or platform fees during the setup period.
-
Calculate time saved per instance. Time the manual version of the task from start to finish. Be honest. Include the time spent correcting errors, not just the time spent on the task itself.
-
Estimate monthly frequency realistically. This is where most calculations fail. Review the last three months of data and halve your initial frequency estimate. Overestimation is the single most common error in break-even modelling for AI automation.
-
Apply the formula. Setup Time ÷ (Time Saved per Instance × Monthly Frequency) = Break-Even Point in months. If the result is under six months, proceed. If it exceeds six months, do not automate.
-
Add variable AI costs to the model. Token fees, inference charges, and API call costs must appear as variable costs per task. A task that saves 10 minutes of staff time but costs £0.50 in API fees per instance has a different contribution margin than a task with no usage fees.
The table below shows how the formula plays out across three common UK business scenarios.
| Scenario | Setup time | Time saved per instance | Monthly frequency | Break-even point |
|---|---|---|---|---|
| Invoice processing | 2 hours | 15 minutes | 4 times | 2 months |
| Monthly reporting | 8 hours | 45 minutes | 1 time | 10.7 months |
| Customer FAQ responses | 3 hours | 5 minutes | 20 times | 1.8 months |
The monthly reporting scenario exceeds the six-month threshold. That is a clear signal to either reduce setup time, increase the frequency of the task, or accept that automation is not cost-effective for that workflow. For more context on how small teams apply these calculations in practice, the Gmdautomation guide for small teams covers practical approaches in detail.
Common pitfalls in AI automation break-even analysis
The most damaging errors in break-even analysis are not mathematical. They are judgement errors made before the formula is even applied.
Overestimating task frequency is the most common mistake. A task that feels frequent often occurs far less than assumed when you check the actual data. Reviewing three months of historical data and halving the estimate produces a far more reliable figure. This single adjustment prevents premature automation of tasks that will never pay off.
Ignoring variable AI costs is the second major error. Token usage and inference fees scale with volume, and a model that looks profitable at 50 tasks per month may become loss-making at 500. Every break-even model must include a sensitivity analysis showing what happens to the result as volume increases.
Relying on opaque AI outputs creates a third category of risk. Language models can produce plausible-looking financial summaries that contain errors. Combining AI interpretation with auditable code ensures that calculations are reproducible and defensible. Finance teams that present AI-generated numbers to boards or auditors without a traceable calculation layer are taking on unnecessary risk.
"Clean cost categorisation is not a preliminary step. It is the analysis. Misclassifying a variable cost as fixed changes the contribution margin, which changes the break-even volume, which changes the investment decision." — Management accounting principle, AllTools CVP framework.
Failing to verify model outputs is closely related. Anomaly detection tools that flag deviations from historical patterns provide a practical safeguard. Building a manual override into any AI-driven financial analysis process is not a sign of distrust in the technology. It is good financial governance. For a broader view of how to reduce AI costs while maintaining accuracy, AI cost reduction guidance from BizDev Strategy covers the key levers in detail.
Key takeaways
Accurate AI automation break-even analysis requires the right formula, clean cost data, realistic frequency estimates, and audit-grade tooling to produce decisions that hold up under scrutiny.
| Point | Details |
|---|---|
| Use the correct formula | Setup Time ÷ (Time Saved per Instance × Monthly Frequency) gives the break-even point in months. |
| Apply the six-month rule | Any automation with a break-even point over six months is not worth pursuing at current conditions. |
| Halve your frequency estimate | Review three months of actual data and halve the figure to avoid the most common overestimation error. |
| Include variable AI costs | Token fees and inference charges must appear as per-task variable costs, not fixed monthly overhead. |
| Demand audit-grade outputs | Use platforms like Kepler or Datarails that produce traceable, reproducible calculations for board and audit use. |
Why frequency estimation is the hardest part of the calculation
The formula for AI automation break-even analysis looks simple. The hard part is not the maths. It is the honesty required to estimate frequency accurately.
Every finance team I have worked with has overestimated how often a task occurs. The instinct is to think of the busiest week and extrapolate from there. The reality is that most business processes have peaks and troughs, and the average is always lower than the peak. When I first applied the six-month rule to a document summarisation workflow, the task felt like it happened daily. The actual log showed it happened eight times a month. Halving that to four times changed the break-even from two months to four months. Still viable, but a very different picture.
The shift to flat-rate pricing from platforms like CallSphere has genuinely changed the calculation for UK businesses. When you know your AI infrastructure costs £149 per month regardless of volume, the variable cost component of the formula becomes much smaller. That predictability makes the analysis more reliable and the investment decision easier to defend.
What I find most valuable about tools like Kepler is not the accuracy figure. It is the traceability. A finance director who can show an auditor exactly which data source produced each line of a break-even model is in a fundamentally stronger position than one who presents a number generated by a language model with no audit trail. The AI automation ROI framework published by Gmdautomation covers this traceability requirement in detail, and it is worth reading before you present any AI-generated financial analysis to a board.
The break-even analysis is not just a gatekeeping tool. It frees up attention. When you know a task will not pay off in six months, you stop spending time on it and redirect that energy to workflows that will. That is the real operational efficiency gain.
— Ravi
AI automation solutions built for UK businesses
Gmdautomation works with UK businesses that need AI automation deployed quickly, priced predictably, and built to hold up under financial scrutiny.
The platform covers implementation, operation, maintenance, and ongoing improvement under a single monthly subscription, with no upfront capital expenditure. That pricing structure maps directly onto the fixed-cost component of a break-even analysis, making the calculation straightforward from day one. Deployment typically takes days rather than months, which reduces setup time costs and brings the break-even point forward. For UK businesses ready to move from analysis to action, Gmdautomation's AI automation platform provides the infrastructure to do it without financial guesswork.
FAQ
What is the formula for AI automation break-even analysis?
The formula is: Setup Time ÷ (Time Saved per Instance × Monthly Frequency). A result under six months indicates the automation is worth pursuing.
How do I estimate monthly task frequency accurately?
Review the actual task log for the past three months and halve the average figure. This adjustment corrects for the overestimation bias that affects most initial frequency estimates.
What hidden costs affect AI automation break-even calculations?
Token usage fees, inference charges, and API call costs are variable costs that scale with task volume. They must be included as per-task costs in the break-even model, not treated as fixed monthly overhead.
Why does audit-grade output matter for break-even analysis?
Finance teams presenting AI-generated numbers to boards or auditors need traceable, reproducible calculations. Platforms like Kepler achieve 94% accuracy on financial line items and map every result back to its source data.
When should a UK business not automate a task?
When the break-even point exceeds six months, the task should not be automated at current conditions. Business needs, platform costs, and AI capabilities change quickly enough to make longer payback periods unreliable.