

AI system uptime measures the proportion of time a service is both reachable and delivering outputs that meet its agreed availability, latency, and quality SLOs simultaneously. A system that responds with HTTP 200s but returns hallucinated or drifted outputs is not "up" in any meaningful production sense.
Typical SLO targets to start from:
- Customer-facing AI services (conversational agents, retrieval systems): 99.9% availability, p95 latency under 2 seconds, quality-sample pass rate above 95%
- Internal automation services (retrieval, automation, batch operations): 99.5% availability, p95 latency under 5 seconds, quality pass rate above 90%
These more detailed targets align with published benchmarks from authoritative industry research and frameworks.
- Critical transactional flows (payment routing, compliance checks): very high availability expected, with strict error-budget policies
Three actions to take now if you have not already:
- Write SLOs covering availability, latency, and output quality for every production AI service.
- Add drift detectors (Population Stability Index or Jensen-Shannon divergence) to your feature pipelines.
- Publish an error-budget policy that specifies what freezes, rolls back, or escalates when budget runs out.
Production-scale AI reliability must be designed in from the start, not retrofitted after the first incident.
Key takeaways
AI system uptime requires meeting availability, latency, and quality SLOs simultaneously; tracking only infrastructure availability leaves silent degradation and drift invisible until they cause user-facing harm.
| Point | Details |
|---|---|
| Three-pillar SLO definition | Uptime requires availability, latency, and quality SLOs to hold at once, not just a 200 OK response. |
| Standard SLO targets | 99.9% for customer-facing services, 99.5% for internal; — for critical transactional flows. |
| Quality metrics are mandatory | Binary availability metrics miss silent degradation; add golden-set checks and rubric-based sampling. |
| MTTR and MTTD by tier | Sev-1 MTTD under 5 minutes, MTTR under 30 minutes; track both per severity tier in every post-mortem. |
| Error-budget policy drives action | Publish a policy that specifies freeze and rollback thresholds before the first incident, not during it. |
Table of Contents
- What does AI system uptime actually measure?
- How AI uptime differs from traditional IT availability
- What core metrics should every team track?
- How do you measure uptime and report it on dashboards?
- What operational practices keep AI services running to SLO?
- How should teams respond to incidents and run post-mortems?
- Sample SLOs and error-budget policies for enterprise AI
- A practical checklist for implementing AI uptime SLOs this quarter
- Why SLO-first thinking is the only approach that holds at scale
- Sources
What does AI system uptime actually measure?
The phrase "AI system uptime" is borrowed from traditional IT availability, but it covers considerably more ground. In enterprise production, uptime requires three conditions to hold at once: the service must be reachable (availability SLO), it must respond within agreed time bounds (latency SLO), and its outputs must meet a defined quality threshold (quality SLO). Fail any one of those and the service is, operationally, down.
Measurement window matters here. Most teams use a rolling 30-day window, expressed as:
Availability (%) = (Successful responses ÷ Total requests) × 100
"Successful" means a response that passes all three SLO conditions, not merely one that returns a non-error HTTP status.
Outage versus degradation
A hard outage is straightforward: the endpoint is unreachable, returns 5xx errors, or exceeds the latency SLO for a sustained period. An outage triggers your incident response immediately.
Silent degradation is the trickier failure mode. The service responds normally by every infrastructure metric, yet output quality has declined: a classification model's accuracy has drifted, a generative model has started producing truncated or factually inconsistent responses, or a retrieval system is returning lower-relevance results. Distributional shift and out-of-distribution inputs are the primary drivers of this class of failure, and they require runtime detection rather than infrastructure alerting.
What counts as excluded: planned maintenance windows (provided they are communicated in advance and within agreed limits), provider-side model updates that do not breach your SLOs, and region-limited degradation that affects fewer requests than your error-budget threshold.
How AI uptime differs from traditional IT availability
Classical SRE treats availability as binary: the service either responds or it does not. That model works well for a database or a REST API returning deterministic results. It breaks down for AI services in three specific ways.
The three failure modes traditional metrics miss:
- Silent quality degradation. A generative model can return 200 OK responses within latency SLOs while its outputs become progressively less accurate or coherent. Binary uptime metrics miss this entirely, which is why quality SLOs are non-optional for AI services.
- Rate limiting and capacity-driven latency spikes. Many LLM API providers throttle at the token or request level. These events rarely appear on provider status pages, yet they account for a significant share of production incidents. Your latency p99 will spike long before any status-page indicator turns amber.
- Model drift. When the statistical distribution of inputs shifts away from training data, model behaviour changes without any code deployment. This is invisible to infrastructure monitoring.
The practical implication: you cannot rely on a vendor's status page as your primary reliability signal. You need your own golden-set checks running continuously in production. Research into AI agent reliability reinforces this, recommending a multidimensional profile covering consistency, robustness, predictability, and safety rather than a single accuracy metric.
For procurement, this means demanding that vendors report hallucination rate, drift indicators, and quality-consistency metrics alongside the standard availability SLA. A vendor who can only show you a green status page is not giving you the data you need.
What core metrics should every team track?
Availability SLO
Availability (%) = (Successful responses ÷ Total requests) × 100
A "successful response" must pass your latency and quality gates, not just return a non-error status. COMPEL Framework guidance sets 99.9% as the standard target for customer-facing services and 99.5% for internal services.
Latency percentiles
Track p50, p95, and p99. For generative models, add time-to-first-token (TTFT) as a separate metric because users perceive streaming latency differently from batch latency. Suggested thresholds for customer-facing services: p95 under 2 seconds, p99 under 5 seconds. Internal services can tolerate p95 under 5 seconds.
Quality SLO
For deterministic systems (classifiers, extractors): accuracy should be measured against a labelled golden set, targeting high accuracy levels appropriate to the service's criticality.
For generative systems: use rubric-based sample scoring on a representative sample to assess output quality, aiming for high pass rates consistent with customer-facing expectations.
Drift rate
Drift rate (%) = (Drifted features ÷ Total monitored features) × 100
Trigger an alert when Population Stability Index (PSI) exceeds a threshold indicating meaningful distributional shift, typically around 0.2, per common practice., or when Jensen-Shannon divergence crosses your calibrated threshold. Either signal warrants investigation before it becomes a quality SLO breach.
MTTR and MTTD by severity tier
MTTD = time from incident start to detection. MTTR = time from detection to full service restoration. Both should be tracked per severity tier and reviewed in post-mortems.
Statistical frameworks for time-based reliability assessment recommend establishing baseline distributions for these metrics before setting targets, so your thresholds reflect actual system behaviour rather than aspirational guesses.
How do you measure uptime and report it on dashboards?
A 30-day rolling window is the standard measurement period for SLO reporting. For drift-sensitive services or those with rapidly changing input distributions, complement this with a 7-day window so you catch emerging drift before it burns through your monthly error budget.
What belongs on your AI reliability dashboard:
- Availability attainment (%) against SLO target, rolling 30 days
- Latency p50, p95, p99 with SLO threshold lines
- Quality-sample pass rate, updated daily from production sampling
- Drift rate per monitored feature, with PSI trend lines
- Error-budget remaining (%), with a burn-rate indicator
- MTTD and MTTR by severity tier, updated per incident
Tooling signals you need:
- Synthetic probes: scheduled requests to a known-input/known-output pair, running every 1–5 minutes. These catch hard outages and latency regressions before real users do.
- Production quality sampling: log a random sample of production inputs and outputs, score them against your rubric or golden set, and feed results into the quality-SLO metric.
- Continuous golden-set checks: a fixed set of labelled examples run against the live model on a schedule. Provider status pages understate meaningful failures, so this is your primary early-warning system for silent degradation.
- Malformed-output logging: capture and count responses that fail structural validation (wrong schema, truncated JSON, empty completions). These often precede broader quality degradation.
Practitioners also recommend tracking token-level latency distributions and retrieval relevance distributions as leading indicators, establishing baseline ranges before scaling so anomalies are detectable.
What operational practices keep AI services running to SLO?
Architecture and operations are where SLO targets become real. The following practices map directly to the metrics above.
Architecture patterns:
- Redundant providers with automatic failover. Run a primary LLM API with a secondary provider on standby. When the primary breaches your latency p95 threshold or returns error rates above your SLO, traffic shifts automatically. This protects both availability and latency SLOs. See enterprise AI deployment models for trade-offs between multi-provider and dedicated-capacity approaches.
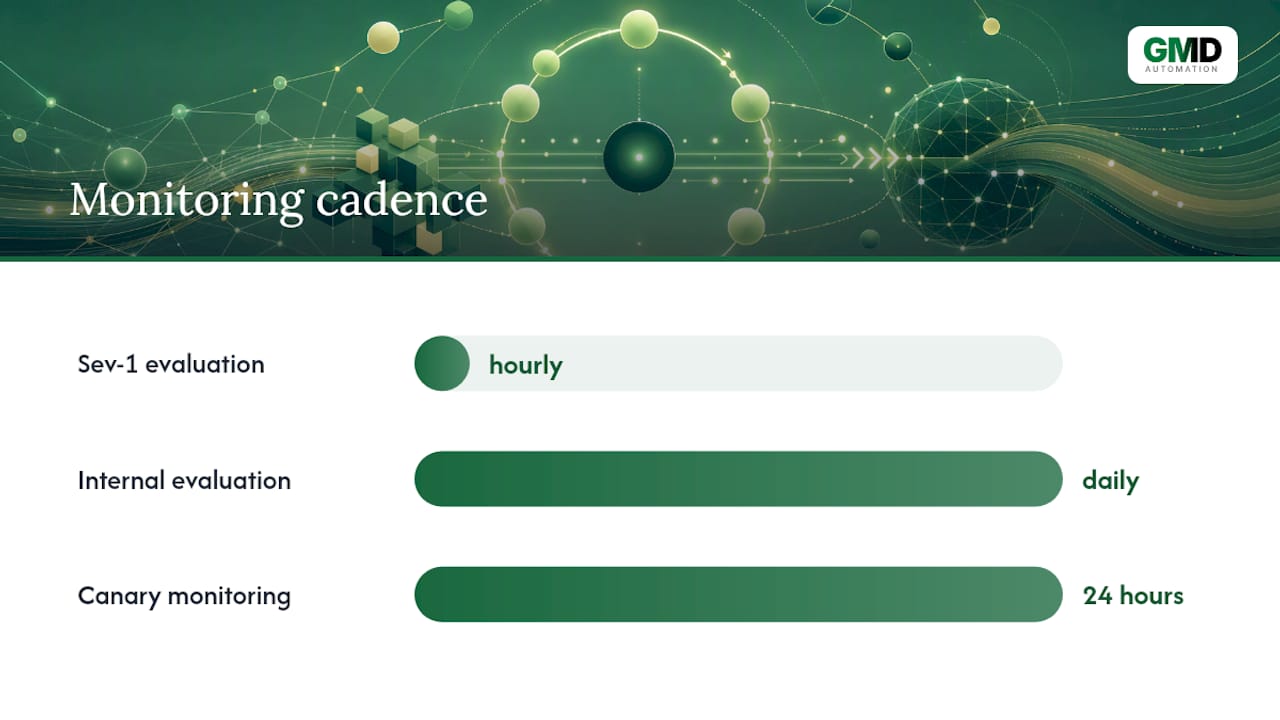
- Canary and staged rollouts. Route 5–10% of traffic to a new model version before full promotion. Monitor quality SLO attainment on the canary cohort for at least 24 hours. If quality degrades, roll back before the majority of users are affected.
- Shadow traffic. Replay production traffic against a candidate model without serving its outputs to users. Compare quality scores against the current model before any live exposure.
- Pin model versions. Never allow a provider to silently update the underlying model without your knowledge. Pin to a specific version and test before migrating.
- Runtime guards and fallback logic. Wrap AI components with deterministic validators that check output structure, length, and content constraints. Dependability research recommends guarding AI components with deterministic monitors so the broader system retains assurance even when the AI component behaves unexpectedly. For AI agent architectures, this means a supervisory layer that can intercept and reroute before a bad output reaches a user.
Operational practices:
- Run continuous evaluation against a golden set on a fixed schedule (hourly for Sev-1 services, daily for internal).
- Deploy feature-level drift detectors on every input feature that materially affects model output. PSI above 0.2 triggers an investigation, not just a log entry.
- Pair SRE and MLOps responsibilities explicitly: SRE owns infrastructure SLOs, MLOps owns quality and drift SLOs. Both attend the same incident review.
- Plan GPU capacity for peak inference load with a headroom margin. Queue saturation is one of the fastest routes to a latency SLO breach. Autoscaling guidance for GPU-bound inference covers this in detail.
Pro Tip: When a provider rate-limit event occurs, your fallback should not just retry the same provider. Route to your secondary, log the event, and review whether your token-budget allocation needs adjusting before the next peak period.
How should teams respond to incidents and run post-mortems?
Incident stages and ownership
Every AI incident moves through five stages: detect, mitigate, diagnose, remediate, review. Ownership should be explicit before an incident happens, not assigned during one.
- Detect: SRE on-call, triggered by synthetic probe or drift alert
- Mitigate: SRE executes runbook (failover, rollback, rate-limit bypass)
- Diagnose: ML engineer investigates quality signals, drift metrics, and model version history
- Remediate: ML engineer and SRE implement fix; product owner approves user communication
- Review: all three roles attend the post-mortem within 48 hours of resolution
Track change-failure rate (proportion of deployments that cause an incident) alongside MTTR and MTTD. A rising change-failure rate signals that your canary or staging process is not catching regressions.
Post-mortem essentials
A post-mortem without a specific fix owner and a verification date is just a document. Every action item must name a person, a completion date, and a measurable acceptance criterion. If the fix cannot be verified, it has not been fixed.
Your post-mortem template should cover: root cause (infrastructure, model, data, or process), service impact (requests affected, SLO breach duration, error-budget consumed), remediation steps taken, open action items with owners and dates, and a scheduled verification check to confirm the fix held.
For AI system maintenance practices, treat quality SLO breaches with the same severity classification and post-mortem rigour as hard outages. Silent degradation that runs for days without a post-mortem is a process failure, not just a model failure.
Sample SLOs and error-budget policies for enterprise AI
Customer-facing conversational agent
- Availability SLO: 99.9% of requests return a valid response within latency bounds, measured over a rolling 30-day window.
- Latency SLO: p95 response time under 2 seconds; p99 under 5 seconds.
- Quality SLO: rubric-based sample scoring pass rate above 95% on a daily 2% production sample.
- Error budget: 0.1% of requests per 30 days may fail any SLO. When 50% of the budget is consumed, freeze non-critical deployments. When 100% is consumed, freeze all deployments and escalate to leadership.
Internal retrieval or automation service
- Availability SLO: 99.5% over a rolling 30-day window.
- Latency SLO: p95 under 5 seconds.
- Quality SLO: golden-set accuracy above 90%, checked daily.
- Error budget: 0.5% of requests per 30 days. At 75% consumed, pause model updates. At 100%, rollback to last stable version.
Downtime equivalents
These figures illustrate how incremental improvements in availability translate to decreased downtime, which matters for stakeholder discussions. For a customer-facing service processing thousands of transactions, that gap has a direct cost.
A practical checklist for implementing AI uptime SLOs this quarter
Work through these in order. Each item has an owner and an acceptance criterion.
- Define SLOs for every production AI service (Week 1–2, owner: product owner + SRE lead). Acceptance: written SLO document covering availability, latency, and quality, signed off by product and engineering.
- Instrument availability and latency metrics (Week 1–2, owner: SRE). Acceptance: dashboard showing real-time availability attainment and latency percentiles against SLO thresholds.
- Deploy synthetic probes (Week 2, owner: SRE). Acceptance: probes running every 5 minutes on all Sev-1 services, alerting within 5 minutes of breach.
- Implement production quality sampling (Week 2–3, owner: ML engineer). Acceptance: daily quality-sample pass rate visible on dashboard, alert configured for drops below SLO threshold.
- Deploy drift detectors on key input features (Week 3–4, owner: ML engineer). Acceptance: PSI and JS divergence calculated daily, alert on PSI > 0.2.
- Write and publish the error-budget policy (Week 3–4, owner: SRE lead + product owner). Acceptance: policy document specifying freeze, rollback, and escalation thresholds, communicated to all engineering teams.
- Create incident runbooks (Week 4, owner: SRE). Acceptance: runbooks covering failover, rollback, and rate-limit bypass for each Sev-1 service, tested in a dry run.
- Schedule the first post-mortem review cycle (Week 4, owner: engineering manager). Acceptance: recurring 48-hour post-mortem process documented and calendar invites sent.
Sprint-level split: items 1–4 fit comfortably in Sprint 1. Items 5–8 form Sprint 2. A third sprint should focus on refining thresholds based on the first 30 days of data.
Why SLO-first thinking is the only approach that holds at scale
Most organisations approach AI reliability the wrong way round. They deploy a model, wait for something to break, then add monitoring. By the time they instrument quality metrics, they have already had incidents they could not explain because they had no baseline to compare against.
The argument for SLO-first thinking is not theoretical. When you define your quality SLO before deployment, you are forced to answer a question most teams skip: what does "working correctly" actually mean for this service? That question surfaces disagreements between product, engineering, and operations that are far cheaper to resolve before go-live than after.
The other thing teams consistently underestimate is the gap between infrastructure reliability and model reliability. An SRE team can achieve 99.9% infrastructure availability and still have a model that is producing wrong answers 15% of the time. Those are two separate problems requiring two separate measurement disciplines, and they need to be owned jointly by SRE and MLOps with shared accountability.
For UK enterprises deploying AI at scale, the managed-service model has a practical advantage here: a provider like Gmdautomation builds SLO instrumentation, drift detection, and error-budget policies into the deployment from day one, rather than leaving those as post-launch engineering tasks. That is not a small operational detail. It is the difference between a system you can trust and one you are perpetually firefighting.
Sources
The sources below underpin the guidance in this article and are worth reading directly for teams building or auditing their AI reliability practice.
- Measuring AI Reliability: SLOs, Drift, and Incident MTTR | COMPEL Framework
- Assurance of AI systems from a dependability perspective (arXiv)
- LLM API Uptime and Reliability Tracker 2026 | Presenc AI
- Assurance and reliability perspectives on AI systems (IOPscience)
- Measuring AI system reliability: the metrics every vendor should report | Clarity
- Statistical perspectives on AI reliability (Tandfonline)